top of page
JOHN HENIFF
-
Visual Graphics
-
Editor
-
Social Media
-
Writer
-
Broadcaster
Visual Graphics
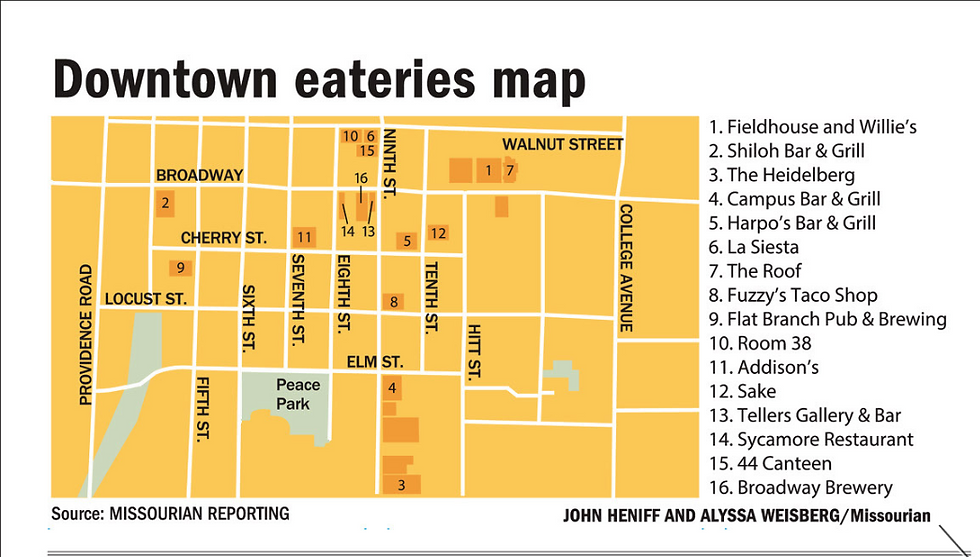
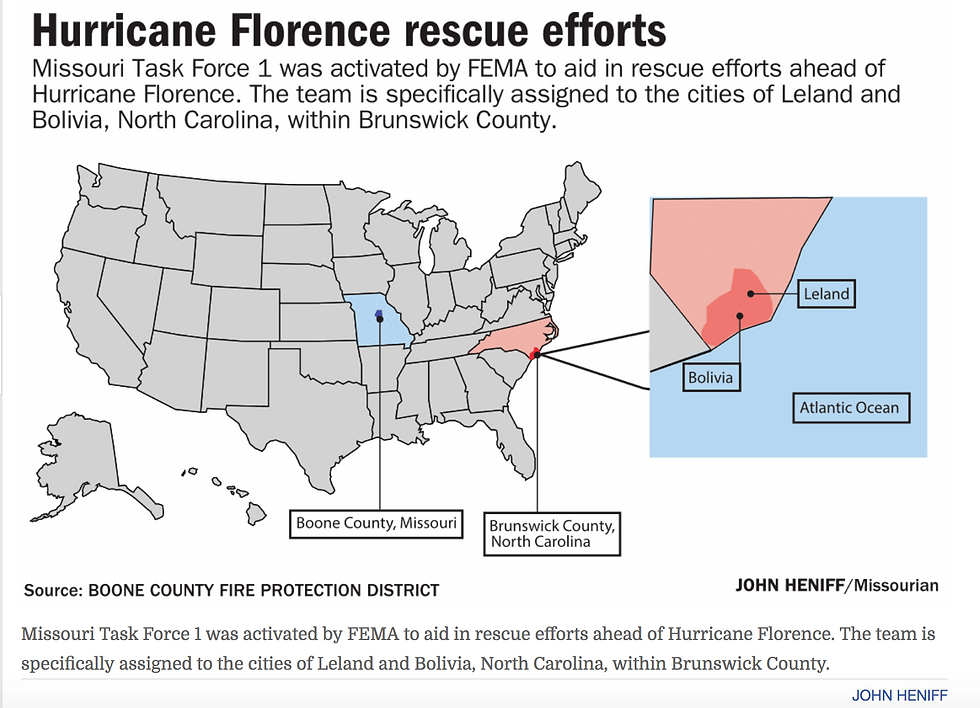
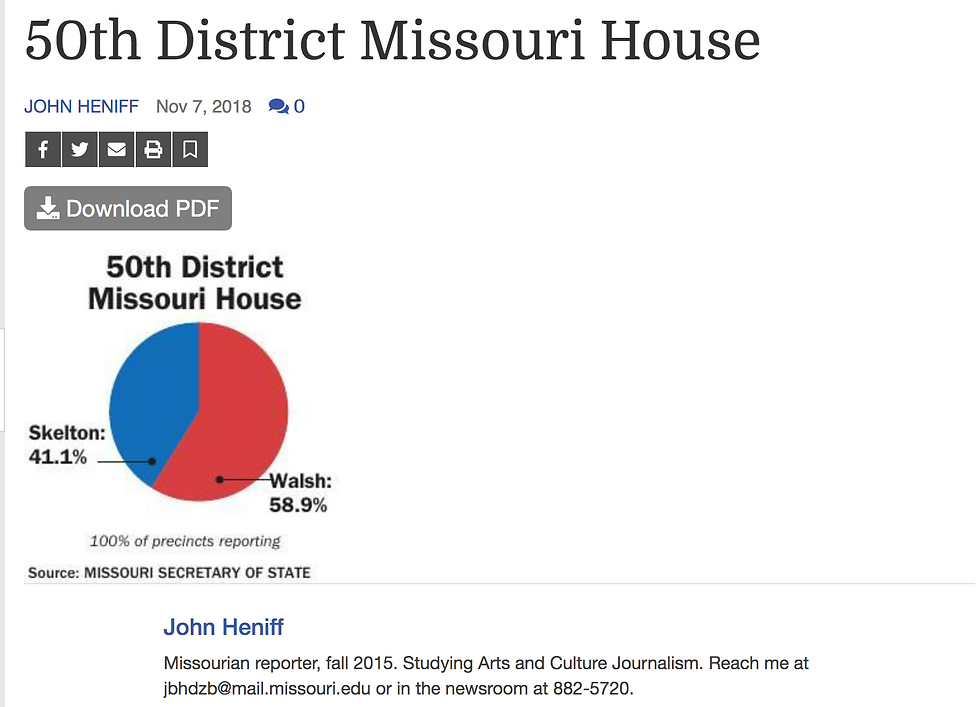
The images featured below are a set of visual information graphics I created while working on the Information Graphics team at the Columbia Missourian during the fall of 2018. The graphics below were created mostly with Adobe Illustrator software as well as Highcharts designs. Microsoft Excel was also used to help mine and properly analyze data before it was transferred into Adobe.


IMG_E1417
bottom of page